When designing a relational database, one of the most important decisions you’ll make is how to structure the data. Should you keep everything neatly organized and broken into smaller pieces, or should you combine tables to make queries faster? These two approaches are known as normalization and denormalization. Understanding the differences will help you design databases that balance accuracy, efficiency, and performance.
What is Normalization?
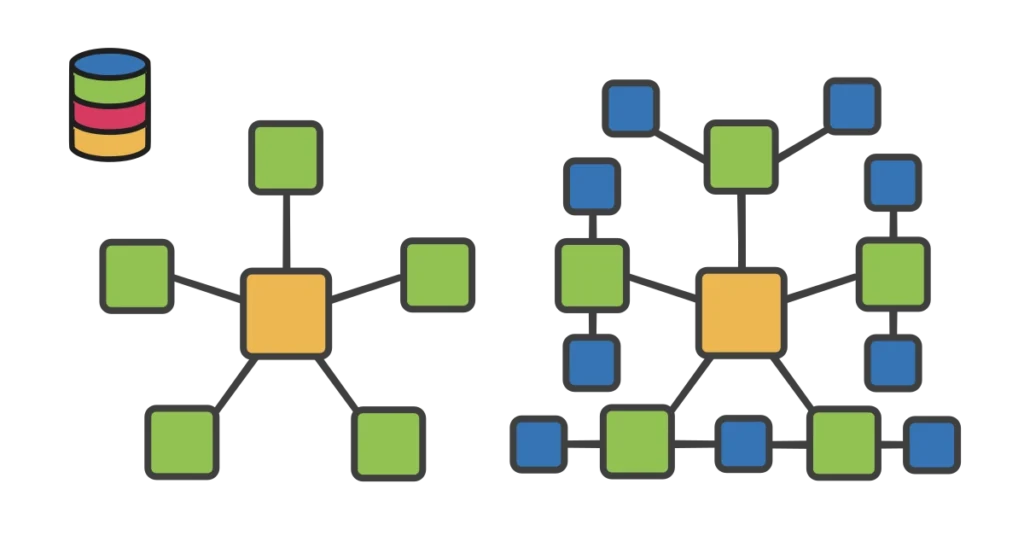
Normalization is the process of organizing data into smaller, related tables to reduce redundancy and improve data integrity. The goal is to make sure each piece of information is stored only once, in the right place, and linked to other data through relationships (foreign keys).
Let’s use the top 10 most visited U.S. National Parks (2023). Instead of storing state information inside every park record, we create a separate States table and link it to the Parks table.
Normalized Example:
Parks Table
| ParkID | ParkName | YearEstablished | StateID | AnnualVisitors |
|---|---|---|---|---|
| 1 | Great Smoky Mountains | 1934 | 1 | 13,297,647 |
| 2 | Grand Canyon | 1919 | 2 | 4,732,101 |
| 3 | Zion | 1919 | 3 | 4,623,238 |
| 4 | Rocky Mountain | 1915 | 4 | 4,115,837 |
| 5 | Yosemite | 1890 | 5 | 3,898,336 |
| 6 | Yellowstone | 1872 | 6 | 3,885,230 |
| 7 | Acadia | 1919 | 7 | 3,872,154 |
| 8 | Cuyahoga Valley | 1974 | 8 | 2,913,312 |
| 9 | Glacier | 1910 | 9 | 2,933,616 |
| 10 | Indiana Dunes | 2019 | 10 | 2,765,010 |
States Table
| StateID | StateName | Region |
|---|---|---|
| 1 | Tennessee | Southeast |
| 2 | Arizona | Southwest |
| 3 | Utah | Southwest |
| 4 | Colorado | Mountain |
| 5 | California | Pacific West |
| 6 | Wyoming | Mountain |
| 7 | Maine | Northeast |
| 8 | Ohio | Midwest |
| 9 | Montana | Mountain |
| 10 | Indiana | Midwest |
Query Example (Normalized):
Suppose we want a report listing park names, their states, and annual visitors. We need to join the two tables:
SELECT P.ParkName,
	   S.StateName,
	   S.Region,
	   P.AnnualVisitors
FROM dbo.Parks AS P
INNER JOIN dbo.States AS S
    ON P.StateID = S.StateID
ORDER BY P.AnnualVisitors DESC;This join ensures we pull consistent state and region data from the States table.
What is Denormalization?
Denormalization is the process of combining tables or introducing redundancy to improve query performance. Instead of splitting data into many small tables, denormalized designs keep more information in fewer tables, so queries require fewer joins.
Using the same parks example, we might store state and region information directly in the Parks table.
Denormalized Example:
Parks Table
| ParkID | ParkName | YearEstablished | StateName | Region | AnnualVisitors |
|---|---|---|---|---|---|
| 1 | Great Smoky Mountains | 1934 | Tennessee | Southeast | 13,297,647 |
| 2 | Grand Canyon | 1919 | Arizona | Southwest | 4,732,101 |
| 3 | Zion | 1919 | Utah | Southwest | 4,623,238 |
| 4 | Rocky Mountain | 1915 | Colorado | Mountain | 4,115,837 |
| 5 | Yosemite | 1890 | California | Pacific West | 3,898,336 |
| 6 | Yellowstone | 1872 | Wyoming | Mountain | 3,885,230 |
| 7 | Acadia | 1919 | Maine | Northeast | 3,872,154 |
| 8 | Cuyahoga Valley | 1974 | Ohio | Midwest | 2,913,312 |
| 9 | Glacier | 1910 | Montana | Mountain | 2,933,616 |
| 10 | Indiana Dunes | 2019 | Indiana | Midwest | 2,765,010 |
Query Example (Denormalized):
With everything in one table, no join is required:
SELECT ParkName,
	   StateName,
	   Region,
	   AnnualVisitors
FROM dbo.Parks
ORDER BY AnnualVisitors DESC;This is simpler and often faster for read-heavy reporting, but comes with the risk of inconsistencies if state or region names change.
Comparing Normalization and Denormalization
| Aspect | Normalization | Denormalization |
|---|---|---|
| Goal | Reduce redundancy, ensure integrity | Improve query performance |
| Structure | Many small, related tables | Fewer, larger tables with redundancy |
| Storage Efficiency | More efficient (less duplication) | Less efficient (more duplication) |
| Query Performance | Slower for complex queries with joins | Faster for reads, fewer joins needed |
| Best For | Transactional systems (OLTP) | Analytical systems (OLAP, reporting) |
Key Takeaway
Normalization and denormalization are not “good” or “bad” choices—they are tools that solve different problems. Most real-world systems use a mix of both. For example, the National Park Service might normalize its operational databases (to keep state and park data consistent) but denormalize its reporting systems (to generate visitation dashboards quickly).
If your system needs accuracy and consistency, lean toward normalization. If it needs speed for analysis, lean toward denormalization.